Richest Cities in Maryland (2025)
by Kristen Carney ![]()
Updated: December 17, 2024
Richest City in Maryland
The richest city in Maryland is Martin's Additions in Montgomery County with an average household income of $526,799 as of 2023. While exceptionally affluent, Martin's Additions only has a population of 931 as of 2023. The richest city in Maryland with at least 5,000 people is Travilah in Montgomery County with an average household income of $335,066 as of 2023 and 11,128 people as of 2023 according to the most current Census data available (citation).
| Rank | City | County | Population | Average Income | Median Income |
|---|---|---|---|---|---|
| 1 | Martin's Additions | Montgomery | 931 | $526,799 | $250,001 |
| 2 | Chevy Chase town | Montgomery | 2,866 | $521,023 | $250,001 |
| 3 | Chevy Chase Village | Montgomery | 2,027 | $517,064 | $250,001 |
| 4 | Chevy Chase Section Five | Montgomery | 663 | $473,810 | $250,001 |
| 5 | Chevy Chase Section Three | Montgomery | 791 | $469,249 | $250,001 |
| 6 | Somerset | Montgomery | 1,177 | $438,623 | $250,001 |
| 7 | Brookmont | Montgomery | 3,825 | $417,550 | $250,001 |
| 8 | Chevy Chase View | Montgomery | 996 | $417,019 | $250,001 |
| 9 | Cabin John | Montgomery | 2,096 | $338,168 | $222,500 |
| 10 | Travilah | Montgomery | 11,128 | $335,066 | $250,001 |
| 11 | North Chevy Chase | Montgomery | 676 | $333,029 | $247,500 |
| 12 | Barnesville | Montgomery | 144 | $328,465 | $223,750 |
| 13 | Fulton | Howard | 5,946 | $324,223 | $240,219 |
| 14 | Highland | Howard | 785 | $308,996 | $250,001 |
| 15 | Chevy Chase CDP | Montgomery | 9,484 | $306,086 | $213,764 |
| 16 | Potomac | Montgomery | 46,230 | $304,509 | $239,205 |
| 17 | Garrett Park | Montgomery | 982 | $290,857 | $250,001 |
| 18 | Bethesda | Montgomery | 67,403 | $290,678 | $191,348 |
| 19 | Darnestown | Montgomery | 6,835 | $289,760 | $217,679 |
| 20 | Laytonsville | Montgomery | 572 | $276,467 | $239,444 |
Median Income versus Average Income: Which Should You Use?
We usually suggest using median income data – either instead of or in addition to – average income data as a true indicator of wealth. If you haven’t thought about median versus average since your last standardized test, you aren’t alone. Here’s what they are:
- average is the sum of a set of numbers divided by the count of numbers in the set
- median is the middle number in the set of numbers
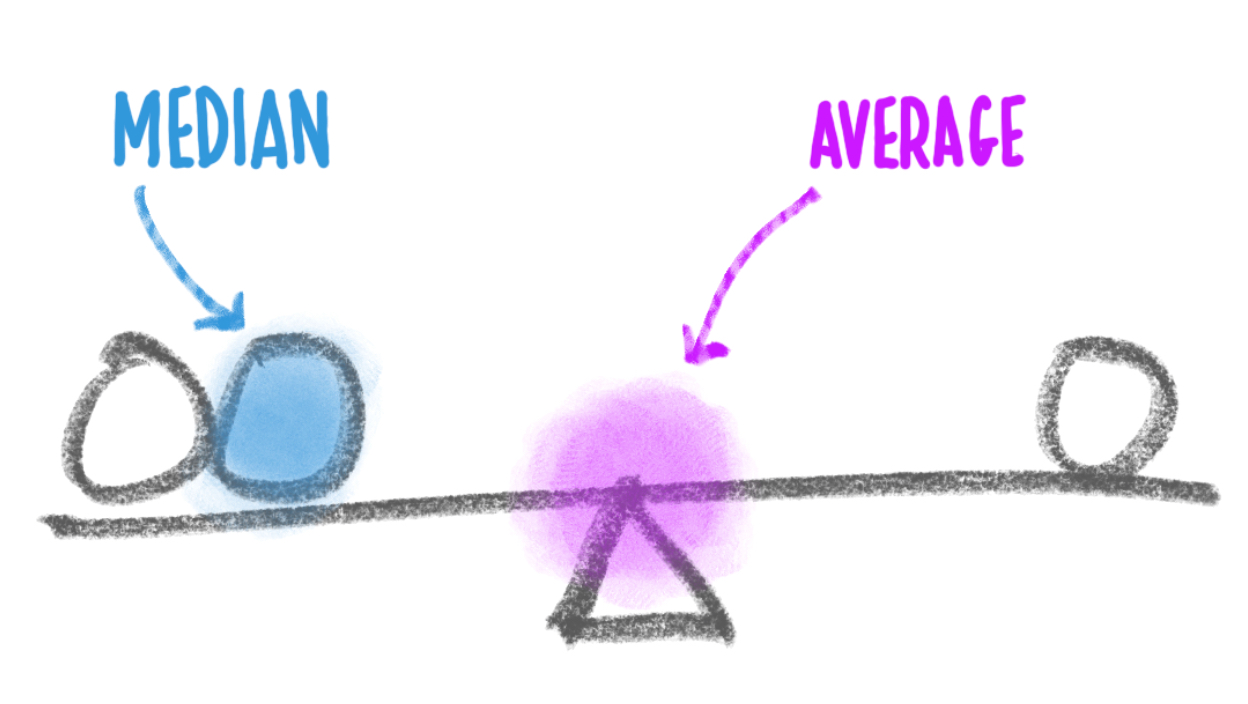
Now let’s say you had the following simplified set of income data.
Household 1: $30,000
Household 2: $50,000
Household 3: $1,000,000
The average income for this set is $360,000. The outlier data point ($1,000,000) skews the average WAY up. Conversely, the average income would be skewed WAY down if someone had an income of $500. The median income for the same data set is $50,000. Outlier data doesn’t skew the median.
Most Business Owners Should Use Median Income
So most business owners should use the median income as a true indicator of wealth, because it provides a more accurate representation of a typical income, especially in areas with significant income disparity.
When Should You Use Average Income
If your target market is high-income households, the average income may be more relevant. This is because the average income can highlight the presence of a higher concentration of wealthy individuals, which is beneficial for luxury goods and services marketing. We’re using average income on this page because using the Census’s highest reported median value of $250,001 could result in multiple ties for the richest geography.
Why do so many cities have a median value of $250,001?
The Census' American Community Survey uses $250,000+ as a jam value for median income estimates to protect privacy, ensure data consistency, and simplify reporting. A "jam value" in survey data refers to a placeholder or default value used when actual data points are unavailable, incomplete, or exceed certain thresholds. We represent this jam value as $250,001 to make it easy for you to sort.
You might also be interested in:
Email Me When New Data Are Released
Join thousands of subscribers and receive just 1 (ONE!) email a year in December when the US Census Bureau releases new income data for Maryland richest cities.
SOURCES
United States Census Bureau. Annual Estimates of the Resident Population: April 1, 2020 to July 1, 2023. U.S. Census Bureau, Population Division. Web. May 2024. http://www.census.gov/.
United States Census Bureau. B01001 SEX BY AGE, 2023 American Community Survey 5-Year Estimates. U.S. Census Bureau, American Community Survey Office. Web. 12 December 2024. http://www.census.gov/.
United States Census Bureau. B19013 Median Household Income, 2023 American Community Survey 5-Year Estimates. U.S. Census Bureau, American Community Survey Office. Web. 12 December 2024. http://www.census.gov/.
United States Census Bureau. “DP03 SELECTED ECONOMIC CHARACTERISTICS.” 2023 American Community Survey 5-Year Estimates. U.S. Census Bureau, American Community Survey Office. Web. 12 December 2024. http://www.census.gov/.
Products & Services
Plumbing
Connect
- 1-800-939-2130
- Contact Us
© Copyright 2025 Cubit Planning, Inc.